
Menu

💻 FMT Analytics 🏆 Placement-led 16 Weeks

FMT Analytics Career Accelerator

Become a job-ready analytics professional with a business-first, portfolio-backed learning path.

The FMT Analytics Career Program is designed as a flagship analytics journey for learners who want real analytical capability rather than isolated software training. Every module is mapped to how an analyst actually works: clarifying business questions, exploring data, building d...

👥 4,200+ enrolled
4.8 (480)
💼 480 jobs live
⚡ High Demand
FM
8+ domain practitioners
Ex-Deloitte, Accenture · Live mentor sessions
4,200+Learner community
100%Placement assistance
500+Hiring partners
₹6–26 LPAAvg. starting CTC
Career outcomes

What you'll achieve

₹6–26 LPA
Salary range
Based on 2,800+ alumni
83%
Placed in 90 days
Post certification
65%
Avg. salary uplift
vs pre-program CTC
480
Live job openings
Right now on Hirevoo
Salary growth

Typical salary trajectory

Based on 2,800+ Hirevoo alumni. Indicative averages only.

Hiring network

Where alumni work

Deloitte
Accenture
EY
KPMG
TCS
Infosys
Wipro
Cognizant
Microsoft
Google
+490 more
480 companies on Hirevoo are actively hiring for FMT Analytics roles right now.
Career specialization

Choose your specialization

Data

Analytics & dashboards

Learn how to analyse business metrics, create dashboards, and present insights using Excel, SQL, Power BI, and Python.

Business reporting SQL & Power BI KPI analysis Portfolio storytelling
Request a callback Data track
Continue to payment
Certificate sample

Industry-recognized certificate of completion
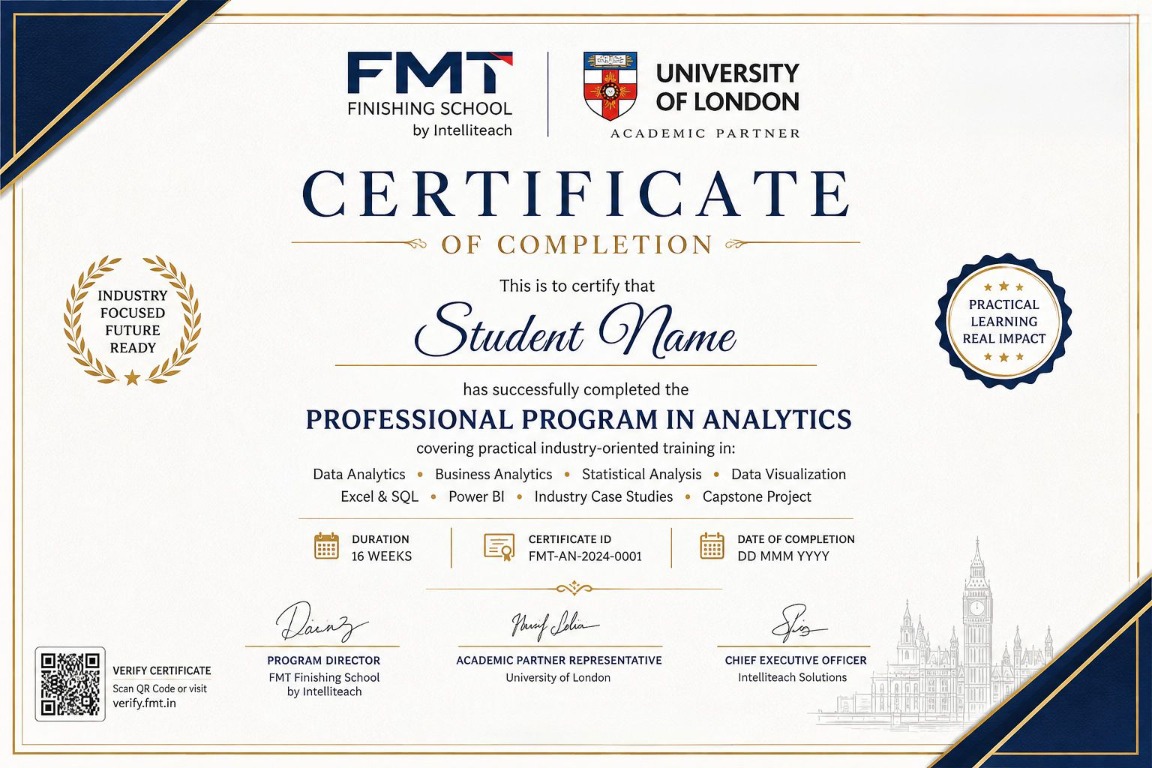
FMT Analytics Career Accelerator sample certificate
Industry stack

Tools you'll master

Excel
Business analysis and reporting
SQL
Data querying and business analysis
Power BI
Dashboard building and executive storytelling
Python
Data cleaning and investigative analysis
Google Analytics
Digital and campaign insights
Jira / MIS tools
Workflow and project tracking
Canva / PPT
Management-ready presentation decks
AI productivity tools
Faster analysis
Many more options
Industry tools & platforms
Learning path

Program curriculum

12 modules · 200+ hours · Live classes + recorded content

Role of an analyst inside an organization
Business functions and how data flows between them
Descriptive, diagnostic, predictive and prescriptive analytics
Business questions vs. analytical questions
KPI and metric design
Data lifecycle and data quality
Root-cause analysis and structured problem solving
Stakeholder requirements and analytical scoping
Insight generation and recommendation writing
Objective

Understand business questions, KPIs, metrics, and the role of analytics in decisions across departments.

Assignments
  • Industry exercise: Investigate a 12% revenue decline and produce a management-ready diagnostic.
Data cleaning, validation and structuring
Logical, lookup, aggregation, date and text functions
XLOOKUP, INDEX/MATCH, SUMIFS, COUNTIFS and error handling
Pivot Tables and Pivot Charts
Dynamic reporting and management MIS
Scenario and what-if analysis
Forecasting fundamentals
Dashboard design and executive reporting
Objective

Build practical analytical workflows in Excel, including workbook design, pivoting, formulas, and management reporting.

Assignments
  • Industry application project: Monthly Business Management MIS Pack.
Relational databases, tables and relationships
SELECT, filtering, sorting and aggregation
GROUP BY, CASE WHEN and business logic
INNER/LEFT joins and multi-table analysis
Subqueries and CTEs
Window functions
Date analysis and NULL handling
Duplicate detection and data validation
Objective

Extract, clean, and answer business questions using relational databases and structured queries.

Assignments
  • Industry application project: Business SQL Analysis Pack with 10–15 management questions.
Data connection and Power Query
Cleaning and transformation
Data modelling and relationships
Star schema fundamentals
DAX measures and calculated columns
Time intelligence
KPI design, drill-through, filters and slicers
Executive dashboard design
Insight-led dashboard storytelling
Objective

Design dashboards and visual stories that communicate insights clearly to leadership.

Assignments
  • Industry application project: Executive Management Intelligence Dashboard.
Descriptive statistics and variability
Probability and distributions
Sampling and confidence intervals
Correlation and regression fundamentals
Hypothesis testing
A/B testing
Statistical significance
Forecasting fundamentals
Business interpretation of statistical output
Objective

Apply statistical reasoning to interpret trends, distributions, and business variability.

Assignments
  • Industry case: Determine whether a campaign or product change produced a statistically meaningful improvement.
Python fundamentals for analysts
NumPy and Pandas
Data cleaning and transformation
Merging and reshaping datasets
Exploratory Data Analysis
Missing values and outliers
Matplotlib and Seaborn
Basic statistical analysis
Analytical automation fundamentals
Objective

Use Python to clean messy datasets and derive clear, actionable insight.

Assignments
  • Industry application project: Clean, investigate and present insights from a dataset.
Customer segmentation
Funnel analysis
Retention and churn insights
Customer value metrics
Objective

Build understanding of customer behavior, retention, segmentation, and revenue drivers.

Variance analysis
Budget vs actual
Financial KPIs
Profitability tracking
Objective

Read financial performance and build analysis for FP&A, profitability, and decision support.

CAC, ROAS, LTV
Campaign analytics
Digital funnel metrics
Budget recommendation
Objective

Measure marketing efficiency and performance using campaign and channel data.

Recruitment analytics
Workforce planning
Attrition and retention
People productivity metrics
Objective

Turn workforce metrics into people and talent decisions using reporting and trend analysis.

Inventory analytics
Logistics KPIs
Procurement insights
Service and cost optimization
Objective

Use data to improve logistics, procurement, demand, and operational performance.

Portfolio project planning
Capstone storytelling
Presentation and QA
Mock interview practice
Objective

Apply analytics frameworks to a business case and communicate insight like an analyst in a real stakeholder setting.

Why us

Why Hirevoo

🏢
1,200+ hiring partners
Active relationships
🏅
Employer-verified certificates
Recognised by 1,200+ cos
🔄
7-day refund
No questions asked
Support

Frequently asked questions

3-Month Plan · EMI
₹44,999
💸 Earn up to ₹5,000 per successful referral

Refer Talent in Your Company & Start Earning

Know open roles in your company? Refer candidates and earn rewards. Just tell us your company and how many people you can refer we’ll connect you with matching candidates.

No cost • Flexible • Quick payouts